A 40% Tariff on Brazilian Green Coffee: What’s at Stake for the U.S.

A 40% Tariff on Brazilian Green Coffee: What’s at Stake for the U.S.
More than 99% of America’s coffee must be imported — mostly raw (“green”) beans. Once in the U.S., they move through storage, roasting, packing, distribution, and retail. The result? Every $1 of imports generates $43 in value for the U.S. economy.
With Trump’s new 40% tariff, the National Coffee Association warns:
Risk of Brazilian exports shifting to China and Europe;
U.S. roasters squeezed by cheaper blends from third countries;
2.2 million American jobs indirectly at risk.
it threatens a $343 billion value chain built on Brazilian coffee.
The U.S.’s main coffee sources:
Brazil (32%)
Colombia (20%)
Vietnam (8%)
Honduras (7%)
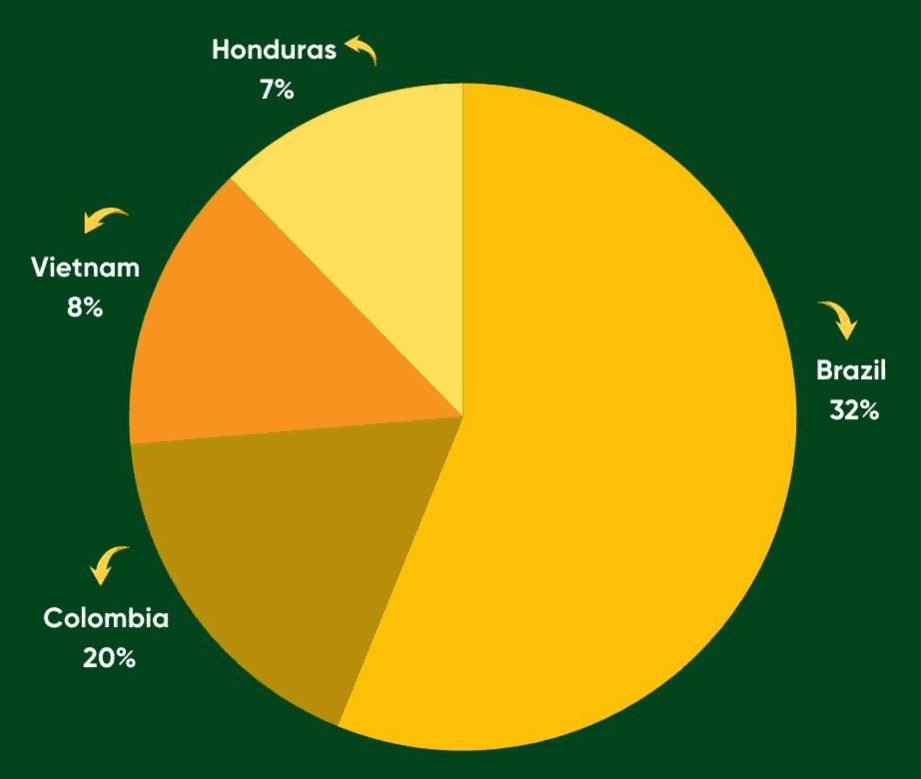
Source: National Coffee Association of USA https://www.ncausa.org/Advocacy/Coffee-and-Trade
US$ volume of green coffee, in grain, supplied by Brazil | ||||
Economic Block | Jan-Jul 2025 - US$ FOB | 2024 - US$ FOB | 2023 - US$ FOB | 2022 - US$ FOB |
| ||||
Europe | 4.725.894.839 | 6.540.138.589 | 4.087.747.245 | 4.996.528.559 |
North America | 1.540.443.390 | 2.389.048.362 | 1.303.110.936 | 1.882.368.430 |
Asia (minus MIDDLE EAST) | 1.232.159.207 | 1.382.798.263 | 1.075.017.181 | 807.758.260 |
South America | 287.806.718 | 262.909.846 | 329.205.399 | 447.199.385 |
Middle East | 169.122.055 | 377.252.372 | 212.206.537 | 156.095.214 |
Africa (minus MIDDLE EAST) | 130.830.026 | 219.178.066 | 149.524.964 | 57.375.622 |
Oceania | 127.037.083 | 139.376.477 | 109.214.952 | 126.423.070 |
Central America and Caribbean | 21.777.409 | 21.231.208 | 48.535.299 | 37.940.518 |
| 8.235.070.727 | 11.331.933.183 | 7.314.562.513 | 8.511.689.058 |
Source: Comex Stat - General Data (https://comexstat.mdic.gov.br/en/geral) Updated on August 2025
Brazil’s main partners:
Europe (~59%)
North America (~20%)
Asia (~12%)
From Brazil to U.S. & China: Tracking Green Coffee Trade Flows (2022–2025)
US$ volume of green coffee, in grain, supplied by Brazil | ||||
|---|---|---|---|---|
Country | Jan-Jul 2025 - US$ FOB | 2024 - US$ FOB | 2023 - US$ FOB | 2022 - US$ FOB |
United States | 1.297.821.218 | 1.895.591.133 | 1.130.932.471 | 1.712.933.414 |
China | 210.382.399 | 213.587.431 | 278.235.184 | 79.254.375 |
Source: Comex Stat - General Data (https://comexstat.mdic.gov.br/en/geral) Updated on August 2025
China opens doors to Brazilian coffee
On July 30, China approved 183 new Brazilian coffee companies to export directly to its market — a timely boost just as the U.S. announced steep tariffs on Brazilian coffee.
Source: China welcomes 183 Brazil coffee sellers in wake of US tariffs | Reuters
Brazilian coffee at a turning point
As U.S. tariffs disrupt traditional flows, new opportunities in Asia and Europe are opening for Brazil to expand market share, attract investment, and reinforce its role as a global leader.
📊 For investors and partners, this is a moment to follow closely: Brazil combines resilience, diversification, and scale in the global coffee market.
👉 Protectionist measures may reshape flows, but they also highlight Brazil’s growing role in global supply chains.